How Do I Compare Planned Staff Allocations With the Hours People Actually Spend on Project Work?
A resource can be allocated to a project and still not be used the way the plan expected.
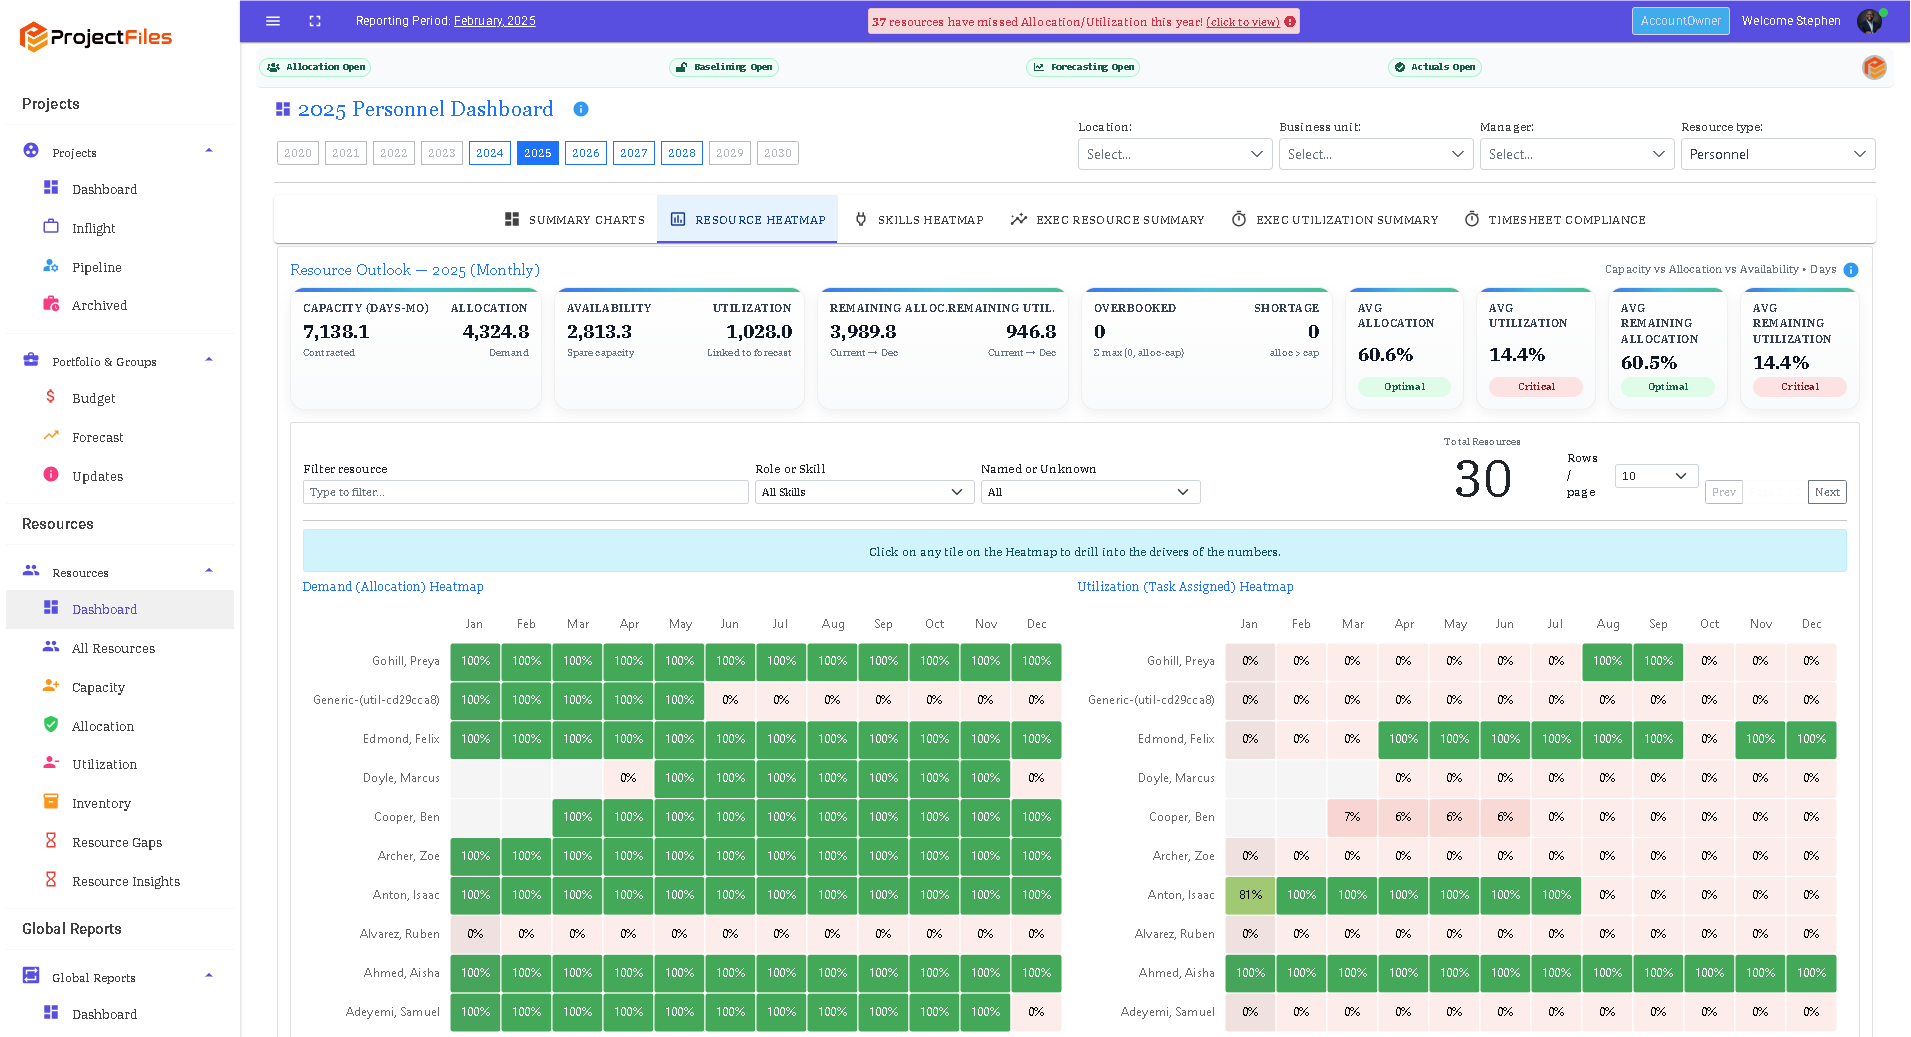
Comparison of planned resource allocation with actual project hours and utilisation
That is why allocation and actual usage are not the same thing.
You may allocate someone 80% to a project for the month.
Then, at month-end, discover they only spent 40% of their time on project work.
Or the opposite: somebody allocated at 50% actually spends nearly all month firefighting on that project.
Both situations tell you something important.
The question is whether you can see the difference early enough to act.
Start by separating the three numbers
I find it useful to keep three things distinct:
Capacity — how much time the person has available.
Allocation — how much of that capacity you have committed to the project.
Actual usage — how much time they really spent doing project work.
For example, imagine someone has 20 working days in April.
You allocate 12 days to Project A.
Their timesheet eventually shows 8 days spent on Project A.
You now have:
Capacity: 20 days
Allocation: 12 days
Actual usage: 8 days
The four-day gap is worth understanding.
Compare allocation with actual time
A simple measure is:
Actual project time ÷ allocated project time
Using the example above:
8 days used ÷ 12 days allocated = 67% of the allocation actually used.
That does not automatically mean somebody performed badly.
It means you have a question to investigate.
Maybe the project was delayed.
Maybe work was not ready.
Maybe the person was pulled onto another priority.
Maybe the allocation was simply too high.
The number starts the conversation. It does not finish it.
Look at the pattern, not just one month
One unusual month may not mean much.
A repeated pattern does.
If somebody is allocated at 80% every month but consistently uses around 40%, you may be reserving capacity the project does not really need.
That capacity could potentially support other work.
The reverse matters too.
If somebody is allocated at 50% but repeatedly records 80–90% of their time on the project, the plan is understating the real demand.
Eventually that will show up somewhere else:
another project slips, BAU suffers, or the person simply gets overloaded.
Compare at project and portfolio level
Looking at one project tells you what happened there.
Looking across the portfolio tells you why.
Suppose Sarah is allocated:
50% to Project A;
30% to Project B; and
20% to BAU.
On paper, she is fully committed.
But her actual time shows:
25% Project A;
60% Project B;
15% BAU.
Project A looks underused.
Project B is consuming twice the planned share.
Without the portfolio view, each project manager only sees half the story.
It is a bit like checking individual bank transactions without looking at the account balance.
The context matters.
Use the difference to improve the next forecast
This is where the comparison becomes more than timesheet reporting.
If actual staff usage differs materially from allocation, ask:
Does the future allocation need to change?
Has the delivery plan changed?
Is the resource still needed?
Is another project consuming more capacity than expected?
Should the financial forecast change too?
Remember: labour time usually has a cost.
So a sustained resource variance can eventually become a financial variance.
That is why resource control and financial control should stay connected.
Watch for these warning signs
A few patterns are especially useful:
High allocation, low actual usage
Capacity may be unnecessarily reserved.
Low allocation, high actual usage
The project may be consuming capacity it never formally secured.
100% allocation across several months
There may be little room for disruption or unexpected work.
Large month-to-month swings
The plan may not reflect how the project is really operating.
Repeated timesheet overruns
The remaining effort or forecast may need to be reconsidered.
Do not turn it into a policing exercise
This part matters.
Comparing allocations with actual hours should not become:
“Why didn't you work exactly the number of hours we gave you?”
Projects are not factories.
Things move.
The value is in understanding the difference and improving the next decision.
Allocation is the intention.
Actual time is the evidence.
The gap between them is information.
The key takeaway
Do not look at allocation or timesheets in isolation.
Compare them.
Then use the difference to improve future capacity, assignments and forecasts.
A strong control loop is:
Allocate → Assign → Record Time → Compare → Correct
That is how resource planning gets better month after month.
Connect planned capacity with actual usage
ProjectFiles connects resource capacity, allocation, project assignments and timesheets so teams can compare what was committed with what was actually used — and correct the future plan.
Clarity. Control. Confidence.
Numbers that hold up when challenged.